Tavex uses cookies to ensure website functionality and improve your user experience. Collecting data from cookies helps us provide the best experience for you, keeps your account secure and allows us to personalise advert content. You can find out more in our cookie policy.
Please select what cookies you allow us to use
Cookies are small files of letters and digits downloaded and saved on your computer or another device (for instance, a mobile phone, a tablet) and saved in your browser while you visit a website. They can be used to track the pages you visit on the website, save the information you enter or remember your preferences such as language settings as long as you’re browsing the website.
Cookie usage
Necessary cookies
| Cookie name | Cookie description | Cookie duration |
|---|---|---|
| tavex_cookie_consent | Stores cookie consent options selected | 60 weeks |
| tavex_customer | Tavex customer ID | 30 days |
| wp-wpml_current_language | Stores selected language | 1 day |
| AWSALB | AWS ALB sticky session cookie | 6 days |
| AWSALBCORS | AWS ALB sticky session cookie | 6 days |
| NO_CACHE | Used to disable page caching | 1 day |
| PHPSESSID | Identifier for PHP session | Session |
| latest_news | Helps to keep notifications relevant by storing the latest news shown | 29 days |
| latest_news_flash | Helps to keep notifications relevant by storing the latest news shown | 29 days |
| tavex_recently_viewed_products | List of recently viewed products | 1 day |
| tavex_compare_amount | Number of items in product comparison view | 1 day |
Preference cookies
| Cookie name | Cookie description | Cookie duration |
|---|---|---|
| chart-widget-tab-*-*-* | Remembers last chart options (i.e currency, time period, etc) | 29 days |
| archive_layout | Stores selected product layout on category pages | 1 day |
Targeting cookies
| Cookie name | Cookie description | Cookie duration |
|---|---|---|
| cartstack.com-* | Used for tracking abandoned shopping carts | 1 year |
| _omappvp | Used by OptinMonster for determining new vs. returning visitors. Expires in 11 years | 11 years |
| _omappvs | Used by OptinMonster for determining when a new visitor becomes a returning visitor | Session |
| om* | Used by OptinMonster to track interactions with campaigns | Persistent |
Analytical cookies
| Cookie name | Cookie description | Cookie duration |
|---|---|---|
| _ga | Used to distinguish users | 2 years |
| _gid | Used to distinguish users | 24 hours |
| _ga_* | Used to persist session state | 2 years |
| _gac_* | Contains campaign related information | 90 days |
| _gat_gtag_* | Used to throttle request rate | 1 minute |
| _fbc | Facebook advertisement cookie | 2 years |
| _fbp | Facebook cookie for distinguishing unique users | 2 years |

The Best Recession Indicator has Given a Major Crisis Warning
Published by Tavex Analysts in category Market News on 13.01.2023
Gold price (XAU-GBP)
2,951.90 GBP/oz
- GBP44.79
Silver price (XAG-GBP)
41.14 GBP/oz
- GBP1.55

Financial markets have been experiencing an event in recent months that has almost always preceded a recession or crisis. The event is called inversion of the yield curve. What does it mean and why is it important?
Movements in financial markets often give clues about what is going to happen in the economy in the near future. This is the case with stock markets, for example – a major fall in stock prices usually starts before a recession. However, if the recession has already arrived, history shows that stock prices have already bottomed out.
But what else points to a recession? Many consider the bond market to be the best predictor of an economic crisis. Specifically, the inversion of the yield curve on government bonds. Let’s talk about what it is and why it is now pointing to an economic crisis.
What is the yield curve?
The US government finances its budget through the sale of various bonds. There are 24 trillion dollars of bonds with different maturities in the market. There are bonds with maturities of one month, three months, two years, 10 years, 20 years and 30 years. It is through the sale of bonds that the national debt is increasing. Other countries around the world finance their budgets in the same way.
What is the yield curve? It is a curve that shows the difference in yields between bonds of different maturities. The yield shows how much the bonds pay (or offer interest) to investors. Normally, the longer the maturity of a bond, the higher the interest rate charged.
The graph below shows a model of the yield curve. The more acutely it rises, the more one expects strong economic growth, higher inflation and higher interest rates. However, when the yield curve flattens, there is more pessimism about the future of the economy. If the yield curve is inverted, the expectation is of a recession or even a crisis.
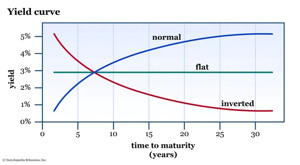
Normal (blue), flattened (green) and inverted yield curve (red). Source: Britannica.
What is an inverted yield curve?
An inverted yield curve for government bonds means that short-term bond yields rise above those of long-term bonds (inverted yield curve). This is considered by many to be the best indicator or predictor of a recession or crisis.
When bond prices fall, bond yields rise and vice versa. When bond prices fall, the associated risks are perceived as higher than before. This will also push up the bond yield, because if the bond price falls below par, the new holder will receive a higher interest rate.
Let’s take a simplified example. Suppose we have a bond with a face value of $100 and an interest rate of 10%. The investor who initially bought the bond will receive $10 interest on the bond each year. If the price of the bond falls to, say, $90, you will still get $10 a year in interest. However, the yield on the bond has risen to 10/90*100%=11.1%. So the new owner of the bond will receive a higher interest rate. The new bond issue will then also have to pay a higher interest rate.
Traditionally, yields on long-term loans are higher because the risks are perceived to be higher when lending over a longer period. From time to time, interest rates on short-term loans rise because the risks associated with the economy are perceived to be higher in the shorter term. This is the inversion of the yield curve.
Should we expect a deep recession?
Let’s look at what has happened in the past. In the case of US Treasuries, we can look at the yield curve inversion over different lengths. The most important ones are considered to be the difference between 10-year and 3-month bonds and between 10-year and 2-year bonds.
Let us look at the yield curve for 10-year and 2-year bonds. Since 1955, the yield on 2-year bonds has risen above that on 10-year bonds ten times. Nine of these events have been followed by a recession (a recession lasting at least two quarters) lasting between 6 and 24 months. In only one case – in the 1960s – has the yield curve not been followed by a recession.
The graph below shows the difference in yields between 10-year and 2-year US bonds. Areas in grey indicate recessions. The inversion of the yield curve is indicated by where the blue line, representing the interest rate differential, has fallen below zero. As can be seen, the pandemic crisis was also preceded by a yield curve inversion in 2019, despite the fact that the virus was not yet reported or active at that time.
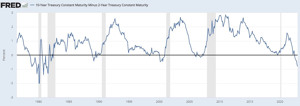
US 10-year bond yield minus US 2-year bond yield. When the graph falls below 0, a yield curve inversion has occurred. Economic recessions are indicated in grey. Source: FRED.
Stagflation ahead?
The Federal Reserve and other central banks are raising interest rates. The inversion of the yield curve suggests that investors believe that central banks will not be able to raise interest rates further without triggering an economic crisis. A somewhat schizophrenic situation has emerged – on the one hand, higher interest rates are trying to control inflation, while on the other, they threaten to bring about an economic crisis.
This means that we are likely to face stagflation in the coming years. This means that the economy will not grow, but inflation will remain high. While a potential economic crisis may bring inflation down in the short term, global trends are more likely to lead to long-term price increases.
Central bank monetary policy is expected to be very hectic in the coming years. It is likely that central banks will be forced to revert to loose monetary policy after the recession, which will reignite inflation. Although precious metal prices have depreciated in recent recessions, this has typically been followed by several years of rapid price increases, supported by money printing.
The very hectic monetary policies of central banks, record levels of debt in the economy and high inflation are likely to create a situation in this decade where deep crises alternate with periods of high inflation. This could lead to a loss of confidence in central banks and currencies. This, in turn, would probably lead to a change in the monetary system.
Published 13.01.2023
Gold price (XAU-GBP)
2,951.90 GBP/oz
- GBP44.79
Silver price (XAG-GBP)
41.14 GBP/oz
- GBP1.55