Tavex uses cookies to ensure website functionality and improve your user experience. Collecting data from cookies helps us provide the best experience for you, keeps your account secure and allows us to personalise advert content. You can find out more in our cookie policy.
Please select what cookies you allow us to use
Cookies are small files of letters and digits downloaded and saved on your computer or another device (for instance, a mobile phone, a tablet) and saved in your browser while you visit a website. They can be used to track the pages you visit on the website, save the information you enter or remember your preferences such as language settings as long as you’re browsing the website.
Cookie usage
Necessary cookies
| Cookie name | Cookie description | Cookie duration |
|---|---|---|
| tavex_cookie_consent | Stores cookie consent options selected | 60 weeks |
| tavex_customer | Tavex customer ID | 30 days |
| wp-wpml_current_language | Stores selected language | 1 day |
| AWSALB | AWS ALB sticky session cookie | 6 days |
| AWSALBCORS | AWS ALB sticky session cookie | 6 days |
| NO_CACHE | Used to disable page caching | 1 day |
| PHPSESSID | Identifier for PHP session | Session |
| latest_news | Helps to keep notifications relevant by storing the latest news shown | 29 days |
| latest_news_flash | Helps to keep notifications relevant by storing the latest news shown | 29 days |
| tavex_recently_viewed_products | List of recently viewed products | 1 day |
| tavex_compare_amount | Number of items in product comparison view | 1 day |
Preference cookies
| Cookie name | Cookie description | Cookie duration |
|---|---|---|
| chart-widget-tab-*-*-* | Remembers last chart options (i.e currency, time period, etc) | 29 days |
| archive_layout | Stores selected product layout on category pages | 1 day |
Targeting cookies
| Cookie name | Cookie description | Cookie duration |
|---|---|---|
| cartstack.com-* | Used for tracking abandoned shopping carts | 1 year |
| _omappvp | Used by OptinMonster for determining new vs. returning visitors. Expires in 11 years | 11 years |
| _omappvs | Used by OptinMonster for determining when a new visitor becomes a returning visitor | Session |
| om* | Used by OptinMonster to track interactions with campaigns | Persistent |
Analytical cookies
| Cookie name | Cookie description | Cookie duration |
|---|---|---|
| _ga | Used to distinguish users | 2 years |
| _gid | Used to distinguish users | 24 hours |
| _ga_* | Used to persist session state | 2 years |
| _gac_* | Contains campaign related information | 90 days |
| _gat_gtag_* | Used to throttle request rate | 1 minute |
| _fbc | Facebook advertisement cookie | 2 years |
| _fbp | Facebook cookie for distinguishing unique users | 2 years |

Silver is Significantly Undervalued Relative to Gold
Published by Tavex Analysts in category Precious Metal Information Guides on 13.02.2024
Gold price (XAU-GBP)
3,096.41 GBP/oz
- GBP16.58
Silver price (XAG-GBP)
45.59 GBP/oz
- GBP0.97

Silver is currently undervalued compared to gold, as evidenced by both the historical market pricing dynamics of these two precious metals and the pronounced scarcity of physical silver in the global market.
In our forthcoming analysis, we will explore the historical gold-to-silver price ratio and examine the evolution of silver’s demand and supply over recent years.
Despite anticipating a long-term price increase for both metals, it is believed that silver is particularly undervalued against gold. This suggests we might soon witness a significant surge in silver prices during the upcoming bullish phase for precious metals.
Silver could be described as gold on steroids – when gold prices climb, silver tends to soar even higher. Conversely, when gold prices decline, silver typically experiences a steeper drop.
What Does the Price Ratio of Gold and Silver Show?
The gold-to-silver price ratio illustrates how many ounces of silver one can purchase with an ounce of gold. For instance, if an ounce of gold costs 2000 euros and an ounce of silver costs 20 euros, then the ratio is 100:1.
This ratio between the two precious metals has seen significant variations over the past century. Historical data reveals that, since 1693, the gold-to-silver ratio has oscillated between 14.1 and 128.7, indicating tenfold differences.
The gap between silver and gold price charts reached an unprecedented peak on March 18, 2020, hitting 128.7, a record high level to date
At present, the ratio stands at 88.78, which is exceptionally high by historical standards. Over the last 300-plus years, the ratio has only exceeded this level for six years on an annual average basis.
Traditionally, the disparity between gold and silver was not as pronounced. Long-term trends indicate that between 1693 and 1875, the ratio consistently ranged between 14 and 17. Throughout history, various nations have fixed the ratio between 10 and 20. For a significant period, the Roman Empire maintained a gold-to-silver ratio of 12:1.
Learn more about the Gold to Silver Ratio here.
The Historical Relationship is More in Line with Reality
The historical correlation between gold and silver prices aligns more closely with the scarcity of these metals. According to Jefferson Lab, the Earth’s crust contains 19 times more silver than gold by volume.
Historically, around 209,000 tons of gold have been extracted globally, compared to about 1.7 million tons of silver
This yields a mined ratio of approximately 8.1 to 1 for gold to silver. However, this calculation does not account for the fact that nearly all the gold ever mined is still in existence, whereas roughly half of the mined silver has been consumed in industrial applications or lost. Silver, unlike gold, is prone to corrosion, and recycling it, especially from industrial uses, is often not economically viable. Therefore, considering the available reserves, the ratio narrows to about 4 to 1.
The US Geological Survey reports that as of 2020, there are about 52,000 tons of recoverable gold (proven reserves that are economically feasible to mine) and 570,000 tons of silver. Consequently, the ratio of underground reserves available for mining stands at 11 to 1. These figures could evolve as technology advances and as the prices of these precious metals increase, potentially making a larger portion of the reserves economically viable for mining.
What Happened in the Last Century?

The gold-to-silver price ratio began to experience increased volatility in the early 20th century, a time marked by world wars and a shift away from precious metals-backed currencies. This era saw countries moving towards the decoupling of gold and silver from their currency systems. The gold standard was an example of this in the United States, where the spot price of gold was linked to the dollar.
Read more about The Gold Standard here.
Throughout the last century, there have been three significant cycles in the gold/silver price ratio. Initially, in the early 1900s, the ratio surged beyond 40, setting a historical precedent. Over the course of the century, this ratio dipped below 20 on two notable occasions (1919 and 1968), reverting to what was considered a traditional level.
Notably, periods of decline in the price ratio have often coincided with a sharp increase in the value of precious metals, significantly enhancing their purchasing power
During these times, silver prices have ascended at a much faster pace, as evidenced by the narrowing of the gold-to-silver price ratio. For instance, if this ratio reduces from 100 to 20, while both metals appreciate in value, it indicates that silver’s price has escalated fivefold compared to gold.
With the current ratio standing at 89, there’s a considerable potential for decline from this level, suggesting that silver is undervalued in comparison to gold, especially when measured against historical benchmarks.
How Big are the Production Numbers and the Demand and Supply?

Let’s also look into the annual production volumes of gold and silver. Metals Focus’ recent data reveals that in 2022, the world saw the production of 3,628 tons of gold and 25,640 tons of silver, establishing a production ratio of 7.1.
The demand for physical gold surged by 18 percent to 4,741 tons in 2022, marking the highest demand since 2011
This spike was primarily fueled by robust purchases from central banks. Meanwhile, the gold supply experienced a 2 percent increase to 4,755 tons in the same year, leading to a slight surplus in the physical gold market.
On the other hand, the physical silver market has faced a significant deficit for three consecutive years, according to Metals Focus. In 2022, silver demand soared to 38,600 tons, while supply lagged significantly, only reaching 31,200 tons – about one-fifth less. The magnitude of the deficit over the past two years has been so substantial that it has offset the total surplus accumulated in the preceding decade.
Industrial Demand for Silver is Growing Exponentially

It’s crucial to understand that nearly half of silver’s total demand stems from its industrial applications, a stark contrast to gold, where industrial usage comprises only about 7 percent of its demand. A significant factor behind the pronounced deficit in the silver market is the surge in industrial demand over the last decade.
Like gold, silver possesses monetary attributes but stands out as the most utilised raw material in a variety of products after oil. While oil finds its way into approximately 30,000 different products, silver is integral to around 10,000.
What’s particularly noteworthy is silver’s essential role in critical future technologies, which drives the swift expansion of its industrial demand. Thanks to its superior electrical conductivity, silver is indispensable in electronics and power-based devices, making up a major portion of its industrial consumption. It plays a vital role in the manufacture of electric vehicles, solar panels, sensors for autonomous vehicles, chips, 5G technology, and more.
Oxford Economics forecasts a 46 percent increase in industrial silver demand between 2023 and 2033
This projection implies that silver production must significantly rise in the near future, or there will be an increasing reliance on underground reserves. A study by researchers in New South Wales has projected that by 2027, solar panel production alone could account for 20 percent of the silver supply. If current trends persist, they estimate that between 85 to 98 percent of the world’s current silver reserves will be allocated to solar panels by 2050.
A Sharp Price Increase Can Be Expected for Silver
The stark distinction between gold and silver lies in their perceived roles: gold is primarily regarded as a safe haven and a hedge against inflation, symbolising a store of money and value. Silver, on the other hand, is increasingly viewed as an industrial metal. Despite this, silver still plays the role of a value store, having been historically used as money and possessing all the monetary attributes. However, gold has more consistently and effectively served this purpose over the past century.

Generally, gold and silver prices move in sync – when one increases, so does the other, and vice versa. Yet, their volatility differs. In bullish markets, silver’s price typically climbs more rapidly than gold’s, and in bearish markets, it tends to decline more sharply.
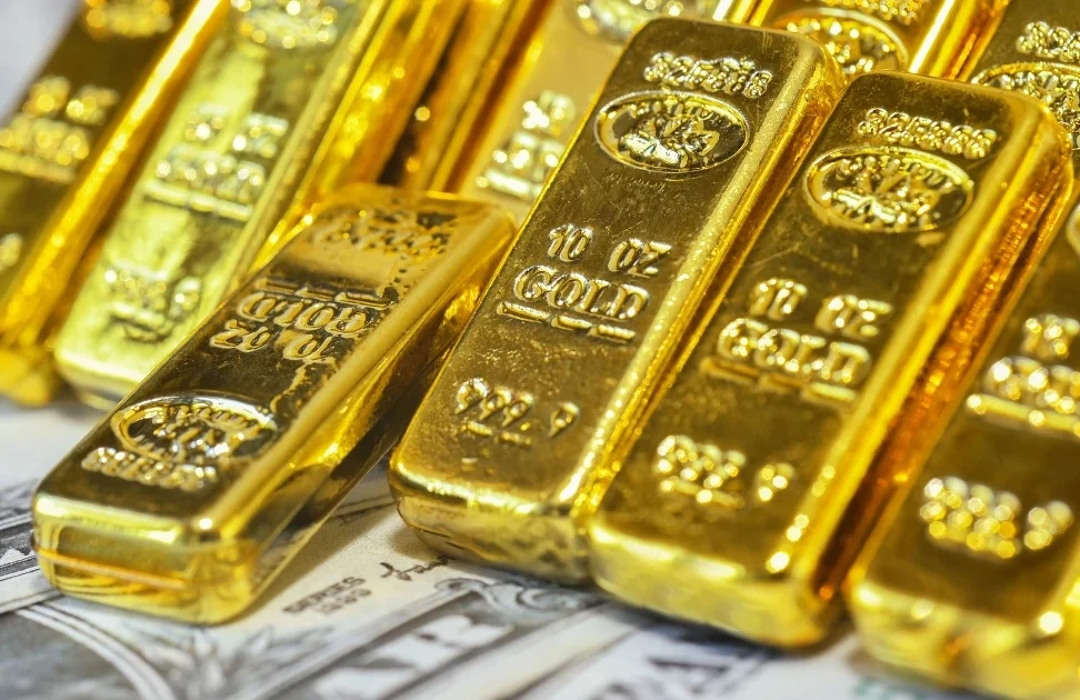
The underlying dynamics of gold indicate that it is in a long-term bullish cycle. Interestingly, when gold prices ascend, silver often outperforms, a trend that data strongly supports. The significant deficit and booming industrial demand for silver bolster the prediction that the gold-to-silver price ratio will narrow, meaning silver is poised to appreciate relative to gold in the forthcoming years. Only time will tell if this affects people investing in gold and buying gold bars and coins.
Gold price (XAU-GBP)
3,096.41 GBP/oz
- GBP16.58
Silver price (XAG-GBP)
45.59 GBP/oz
- GBP0.97