Tavex uses cookies to ensure website functionality and improve your user experience. Collecting data from cookies helps us provide the best experience for you, keeps your account secure and allows us to personalise advert content. You can find out more in our cookie policy.
Please select what cookies you allow us to use
Cookies are small files of letters and digits downloaded and saved on your computer or another device (for instance, a mobile phone, a tablet) and saved in your browser while you visit a website. They can be used to track the pages you visit on the website, save the information you enter or remember your preferences such as language settings as long as you’re browsing the website.
Cookie usage
Necessary cookies
| Cookie name | Cookie description | Cookie duration |
|---|---|---|
| tavex_cookie_consent | Stores cookie consent options selected | 60 weeks |
| tavex_customer | Tavex customer ID | 30 days |
| wp-wpml_current_language | Stores selected language | 1 day |
| AWSALB | AWS ALB sticky session cookie | 6 days |
| AWSALBCORS | AWS ALB sticky session cookie | 6 days |
| NO_CACHE | Used to disable page caching | 1 day |
| PHPSESSID | Identifier for PHP session | Session |
| latest_news | Helps to keep notifications relevant by storing the latest news shown | 29 days |
| latest_news_flash | Helps to keep notifications relevant by storing the latest news shown | 29 days |
| tavex_recently_viewed_products | List of recently viewed products | 1 day |
| tavex_compare_amount | Number of items in product comparison view | 1 day |
Preference cookies
| Cookie name | Cookie description | Cookie duration |
|---|---|---|
| chart-widget-tab-*-*-* | Remembers last chart options (i.e currency, time period, etc) | 29 days |
| archive_layout | Stores selected product layout on category pages | 1 day |
Targeting cookies
| Cookie name | Cookie description | Cookie duration |
|---|---|---|
| cartstack.com-* | Used for tracking abandoned shopping carts | 1 year |
| _omappvp | Used by OptinMonster for determining new vs. returning visitors. Expires in 11 years | 11 years |
| _omappvs | Used by OptinMonster for determining when a new visitor becomes a returning visitor | Session |
| om* | Used by OptinMonster to track interactions with campaigns | Persistent |
Analytical cookies
| Cookie name | Cookie description | Cookie duration |
|---|---|---|
| _ga | Used to distinguish users | 2 years |
| _gid | Used to distinguish users | 24 hours |
| _ga_* | Used to persist session state | 2 years |
| _gac_* | Contains campaign related information | 90 days |
| _gat_gtag_* | Used to throttle request rate | 1 minute |
| _fbc | Facebook advertisement cookie | 2 years |
| _fbp | Facebook cookie for distinguishing unique users | 2 years |

Gold Price Rose to a New Record in November. Sunday Night was the Most Important event in The Gold Market in 4 Years
Published by Tavex Analysts in category Market News on 13.12.2023
Gold price (XAU-GBP)
3,042.86 GBP/oz
+ GBP3.83
Silver price (XAG-GBP)
43.76 GBP/oz
+ GBP0.54

One of the most significant events in the gold market in the last four years, occurred on Sunday 3rd December night – a years-long resistance level was broken, potentially leading to new highs next year. Furthermore, a significant trend can be seen in which the impact of real interest rates on gold has decreased.
The price of gold increased by 4.5 percent in November, ending the month at $2,071.88 per ounce, a new all-time high. The previous price high was set on August 6, 2020, when gold closed at $2,063.3.
Friday’s price record was followed by an extraordinary price movement against Monday on Sunday night (December 3), when gold rose by $77, or 3.7 percent, in just one hour. Such movements in the gold market are extremely rare and are usually associated with specific events. For example, we saw very large short-term movements in both the Brexit vote outcome and the start of the Ukrainian war.
The reason this time, however, was largely technical. Gold has been held in the 2050–2070 dollar range for nearly three and a half years – the price was there in August 2020, March 2022, and May 2023.
This resulted in a very strong resistance level that gold has found extremely difficult to break. However, gold closed just short of an all-time high on November 30th, and the month ended with a record high as well. On the same day, Federal Reserve Chairman Jerome Powell stated that markets are underestimating the likelihood of further rate hikes.
In general, such central bank messages have had a negative impact on gold, because higher interest rates make gold less appealing in comparison to bonds (interest rate increases are typically accompanied by an increase in bond yields). This time, however, the opposite occurred: gold reached a new high, and Powell’s words essentially went in one ear and out the other for gold traders.
As a result, the last day of November demonstrated to investors that the gold market is in a very strong state and may break through the $2050-2070 level. This sparked a rush of buying as soon as markets opened on Sunday, with gold reaching a new intraday high of $2,148.9 per ounce.
The Gold Market’s Most Significant Event in Recent Years
Looking at the technical picture, this is the most significant event for the gold market in recent years: a strong resistance level that had been in place for nearly four years was broken. And it was done with force.
True, gold fell sharply after reaching new highs, pushing the price back to $2,030 per ounce. It is also somewhat negative that gold was unable to hold decisively above the level of around $2070, which was an impediment.
This raises the possibility that it was a phoney breakout, and the level will continue to act as a strong barrier. However, such a picture only looks at the chart, where each candle represents the price movement of one day. Of course, there is also a very strong intraday breakout here:
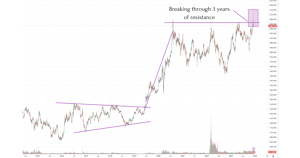
However, when looking at the monthly graph, the breakthrough is much clearer:
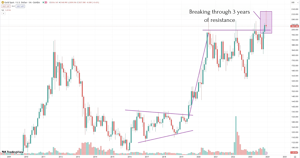
Monthly gold price chart (each candle represents one month’s price movement).
Source: Tradingview
The last day of November record, as well as the subsequent price movement on Sunday, indicate that gold has entered a new phase in which the rules that have been in place for four years have been broken. The intraday movement on Sunday was just that sharp and decisive, and the monthly chart shows a strong breakout as well. As a result, it is more likely that we will see new gold price records, as well as a new price plateau and the formation of a technical structure, next year.
This article is also supported by the fact that, because nothing extraordinary occurred on Sunday night (for example, a war or a major event in the markets), the accompanying movements were brief and sharp (and may have been accompanied by false breakouts). Such things, for example, can be observed in the case of geopolitical events, which you can learn more about here.
Of course, the price may fall before forming a new plateau, as it has risen rapidly since the beginning of October. In this regard, the tipping point has been reached, and if we consider the fundamental factors and the technical picture, we can quickly reach the range of 2300-3000 dollars.
The Gold Market Paradigm That Has Been in Place for a Long Time May be Changing.
Although the Federal Reserve’s chairman indicated at the end of November that interest rate hikes might not be over, markets are already pricing in a drop in interest rates in the first half of next year. The markets appear to have dismissed Powell’s remarks as a bluff and did not take them seriously.
Historically, the medium-term price of gold has been largely determined by the real yield (inflation-adjusted interest yield) on US government bonds and the US dollar exchange rate. If both fall, the price of gold will be affected in both positive and negative ways. More information on the relationship between bond real yields and gold prices can be found here.
It is worth noting, however, that the price of gold has moved somewhat away from the movement of real interest rates over the last year. In my opinion, a new paradigm is emerging in which the price of gold is less dependent on real interest rates and the value of the dollar.
In November, real interest rates reached their highest level since the 2008 financial crisis. What happened to gold at the same time? They soared to new heights without blinking. True, the market is also heavily influenced by expectations, specifically the expected direction of interest rates in the future, which is downward. Nonetheless, such a disconnection from genuine interests is significant.
When real interest rates were this high, an ounce of gold cost nearly half as much (around $900).
Physical demand (especially by central banks), irresponsible fiscal policies and debt burdens of countries, money printing by central banks following every crisis (and increasing liquidity in the system), and long-term inflation and stagflation appear to be affecting gold more.
Gold price (XAU-GBP)
3,042.86 GBP/oz
+ GBP3.83
Silver price (XAG-GBP)
43.76 GBP/oz
+ GBP0.54