Tavex uses cookies to ensure website functionality and improve your user experience. Collecting data from cookies helps us provide the best experience for you, keeps your account secure and allows us to personalise advert content. You can find out more in our cookie policy.
Please select what cookies you allow us to use
Cookies are small files of letters and digits downloaded and saved on your computer or another device (for instance, a mobile phone, a tablet) and saved in your browser while you visit a website. They can be used to track the pages you visit on the website, save the information you enter or remember your preferences such as language settings as long as you’re browsing the website.
Cookie usage
Necessary cookies
| Cookie name | Cookie description | Cookie duration |
|---|---|---|
| tavex_cookie_consent | Stores cookie consent options selected | 60 weeks |
| tavex_customer | Tavex customer ID | 30 days |
| wp-wpml_current_language | Stores selected language | 1 day |
| AWSALB | AWS ALB sticky session cookie | 6 days |
| AWSALBCORS | AWS ALB sticky session cookie | 6 days |
| NO_CACHE | Used to disable page caching | 1 day |
| PHPSESSID | Identifier for PHP session | Session |
| latest_news | Helps to keep notifications relevant by storing the latest news shown | 29 days |
| latest_news_flash | Helps to keep notifications relevant by storing the latest news shown | 29 days |
| tavex_recently_viewed_products | List of recently viewed products | 1 day |
| tavex_compare_amount | Number of items in product comparison view | 1 day |
Preference cookies
| Cookie name | Cookie description | Cookie duration |
|---|---|---|
| chart-widget-tab-*-*-* | Remembers last chart options (i.e currency, time period, etc) | 29 days |
| archive_layout | Stores selected product layout on category pages | 1 day |
Targeting cookies
| Cookie name | Cookie description | Cookie duration |
|---|---|---|
| cartstack.com-* | Used for tracking abandoned shopping carts | 1 year |
| _omappvp | Used by OptinMonster for determining new vs. returning visitors. Expires in 11 years | 11 years |
| _omappvs | Used by OptinMonster for determining when a new visitor becomes a returning visitor | Session |
| om* | Used by OptinMonster to track interactions with campaigns | Persistent |
Analytical cookies
| Cookie name | Cookie description | Cookie duration |
|---|---|---|
| _ga | Used to distinguish users | 2 years |
| _gid | Used to distinguish users | 24 hours |
| _ga_* | Used to persist session state | 2 years |
| _gac_* | Contains campaign related information | 90 days |
| _gat_gtag_* | Used to throttle request rate | 1 minute |
| _fbc | Facebook advertisement cookie | 2 years |
| _fbp | Facebook cookie for distinguishing unique users | 2 years |

When Can We Expect New Gold Price Records?
Published by honor in category Precious Metal Information Guides on 16.07.2025
Gold price (XAU-GBP)
3,529.06 GBP/oz
- GBP8.23
Silver price (XAG-GBP)
55.62 GBP/oz
+ GBP0.78

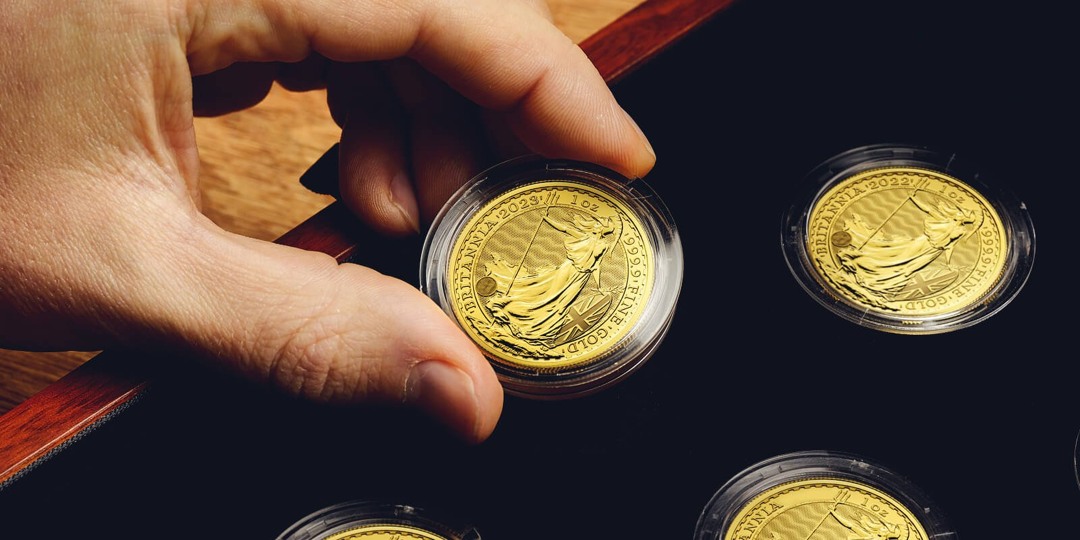
The price of gold has been moving sideways in recent months but remains high, having already risen by 28 percent in dollar terms this year. Analysts expect the price to continue rising and potentially reach new records in the autumn months.
In mid-April, gold surged to $3,500 an ounce, driven largely by former US President Donald Trump’s tariff policies. Since then, the price has moved sideways, reaching a low of $3,120 in mid-May. Gold rose by 0.4 percent in June, by 1.8 percent in July, and is currently trading at $3,360.
The gold market is currently showing significant strength. The sharp increase in April was exceptionally fast, and gold’s ability to maintain high levels despite corrections indicates resilience. Furthermore, volatility has decreased in recent months, which is viewed as a positive signal. This suggests that a long-term upward trend may continue in the coming months. Given the strong fundamental backdrop, many market watchers expect new record highs in the autumn.
Gold is Affected by Trump’s Policies in the Short Term
In the short term, gold prices are heavily influenced by policies introduced by former US President Donald Trump, which once again supported prices in July.
Trump announced in early July that he would raise tariffs on imports from the European Union and Mexico to 30 percent starting next month. He also threatened similar measures on goods from Japan and South Korea.
Additionally, Trump urged the Federal Reserve to lower the base interest rate to 1 percent, aiming to reduce government borrowing costs and finance the growing budget deficit on more favourable terms. His new spending plan, recently signed into law, is expected to further strain the US budget. Currently, the Federal Reserve’s base interest rate stands at 4.25–4.5 percent.

Trump’s demands highlight the critical state of the US budget. The increase in spending was also one of the reasons why Elon Musk, formerly head of the Department of Government Efficiency, left the government. Musk later criticised the spending plan sharply, warning that the US was heading towards “bankruptcy.”
Long-Term Underlying Trends
These developments also point to the key underlying trend driving gold prices – the rapid growth of government debt and the declining status of government bonds as a “safe haven” asset. Over the long term, capital is expected to shift from government bonds to so-called anti-fiat assets, as high debt burdens are likely to be eased through currency dilution, or money printing.
The actions of Trump and the US also reflect a broader shift in the global financial system
US hegemony is weakening, and emerging economies are gaining influence. The use of the dollar as a weapon and the imposition of tariffs indicate that the dollar is increasingly losing its status as an international reserve asset. Gold is gradually taking over this role, with its share in central bank reserves growing significantly.
This trend is confirmed by a recent World Gold Council (WGC) survey, which revealed that central banks are increasingly planning to divest from dollar-linked assets and increase their gold holdings.
These long-term trends are expected to be among the main drivers pushing gold prices higher in the coming years.
In addition, the WGC reported that gold inflows into exchange-traded funds (ETFs) were the highest in five years during the first half of the year. ETF inflows and central bank purchases have been the main contributors to price growth this year. Although there was an outflow from ETFs in May, strong buying returned in June, providing confidence that gold prices may reach new records in the autumn.
Analysts continue to forecast that gold could rise to the $6,000–$7,000 range by 2030
This projection assumes an average annual appreciation of 13–16 percent over the next five years. Since 1971, gold has delivered an average annual return of 8 percent. Given the robust fundamental picture, many believe that gold may exceed its historical growth rate by about twice in the coming years.
Silver Has Begun to Surpass Gold in Price Growth

Silver has also been on the rise over the past two months. Price movements in June and July have been among the most significant events in the silver market in recent years. The price of silver broke through a long-standing resistance level and reached a 14-year high. The breakthrough was first noted in early June, and the price has continued to climb since then.
In June, silver prices rose by 9.4 percent, followed by a 6.3 percent increase in July, and currently stand at $38.4 per ounce. So far this year, silver has surged by an impressive 32.8 percent, now outperforming gold. Last year, silver had lagged behind gold in the rise in price.

This development is significant within the context of the bullish cycle for precious metals. Silver tends to lag behind gold at the beginning of a bullish cycle but often outperforms later on — a pattern that has clearly begun to unfold in recent months. It is now considered quite likely that silver will test its 2011 record of $49.8 per ounce this year.
This thesis is also supported by movements in the gold-silver price ratio (the number of ounces of silver required to purchase one ounce of gold). In recent months, this ratio has fallen sharply, indicating silver’s relative strength. While the ratio peaked in April at 107, it has now declined to 87.7.
The gold-silver ratio is expected to continue falling. It could reach 75 this year, and potentially drop to 60 in the coming years. If gold were to reach $6,000 per ounce by 2030 and the ratio fell to 60, this would imply a silver price in the triple digits.
Gold price (XAU-GBP)
3,529.06 GBP/oz
- GBP8.23
Silver price (XAG-GBP)
55.62 GBP/oz
+ GBP0.78